

Why we love infographics (and you should, too!)
My love of infographics began when I was a design student at NSCAD. In those days we called them diagrams, graphs, maps, and charts. A good infographic makes a complex topic clearer for the reader and is done in a visually appealing manner by using type, line, colour, form, illustration, and photos.
It is accomplished by taking the information and rearranging it so that the reader understands the key message quickly. They can be simple or complex. And not all are well thought out or executed. With the rise of social media and people spending more time in front of a screen, the use of infographics has also increased. But I have seen a lot of infographics that don’t really hit the mark. Let’s look at the following:

This infographic intriguing, but what is the message?
- The title is divided by the cup of coffee in the middle – I first thought it was an infographic about coffee and not beverages in general
- What are those green fronds in the middle? Do they add any valuable information?
- Most people I know usually have their wake-up, breakfast, lunch, then dinner. This infographic makes the readers’ eyes jump around the page. A better solution would have been to have in a sequential line or at least sequentially around the circle.
- The captions show some nutritional values but are not consistent, i.e.: some types of cola have caffeine
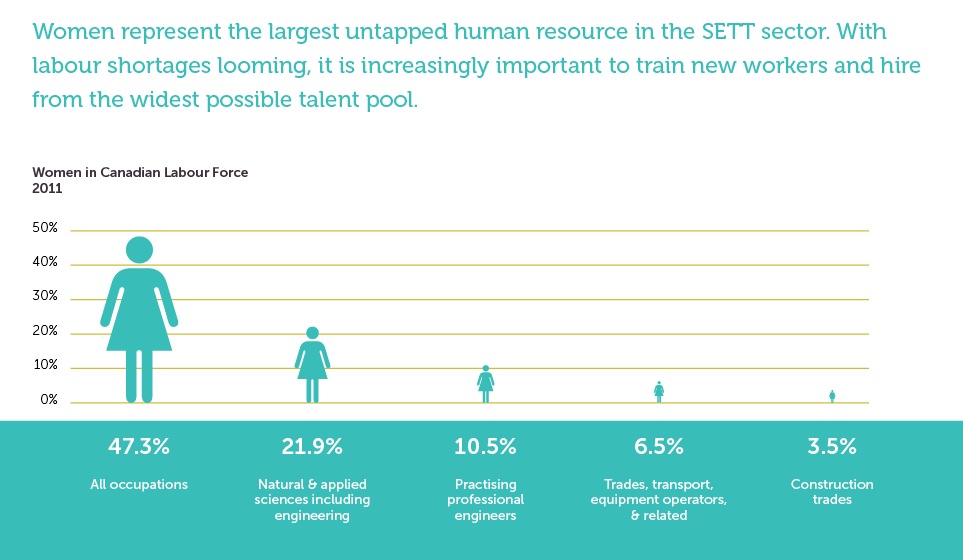
Below is a chart that was supplied to us and the simple yet effect infographic that we designed.

Infographics don’t need to be complicated – they just need to be well designed.
